Debugging in Dicoogle
This section provides a few guidelines and approaches to debugging solutions in Dicoogle.
Logging
Dicoogle uses slf4j for logging the software’s internal functioning, backed by log4j2. Plugin developers are recommended to use slf4j in their plugins as well. It is already included in the dicoogle SDK package, so no additional dependencies are required.
The most common usage is a class-level logger instance, which is created like this:
import org.slf4j.Logger;
import org.slf4j.LoggerFactory;

public class MyAmazingPlugin implements JettyPluginInterface {
    private static final Logger logger = LoggerFactory.getLogger(MyAmazingPlugin.class);

    // ...
}
You may then use the logger object like this:
logger.warn("Could not find query provider {}", providerName);
Please see the slf4j user manual for more information. The FAQ also provides excellent tips on how to use (and how not to use) the API. In particular:
- Avoid performing concatenations in the logged text (i.e. do not write
logger.info("Status: " + status);); use template matching instead (e.g.logger.info("Status: {}", status);). - Do not call
toString()on the template arguments, as this is done automatically and only when needed. - Restrict ERROR level log instructions to situations where something critical occurred in the application, often associated to bugs in the software, and that should be attended by an administrator. Less critical issues should be logged with the WARNING level or lower.
- Logging lines for fine-grained debugging purposes should be at either level DEBUG or TRACE.
When seeking to debug a particular plugin, it is useful to configure the logging framework to output messages of lower levels. You can configure Dicoogle to show these messages with a custom log4j2 configuration file, such as the one below.
<?xml version="1.0" encoding="UTF-8"?>
<Configuration>
    <Appenders>
        <!-- This appender describes the console's standard output -->
        <Console name="STDOUT" target="SYSTEM_OUT">
            <PatternLayout pattern="%-5p %C{2} (%F:%L) - %m%n"/>
        </Console>
        <!-- This appender describes a file logging strategy which writes the latest
            lines to "dicoogle.log" and keeps previous logs in "dicoogle-#.log" files,
            rolling to a new file as the server restarts or the file becomes too large.
         -->
        <RollingRandomAccessFile name="Rolling" fileName="dicoogle.log" filePattern="dicoogle-%i.log" >
            <PatternLayout pattern="%d{yyyy-MM-dd HH:mm:ss} | %-5p [%t] (%F:%L) - %m%n"/>
            <Policies>
                <OnStartupTriggeringPolicy />
                <SizeBasedTriggeringPolicy size="2.0 MB"/>
            </Policies>
        </RollingRandomAccessFile>
    </Appenders>
    <Loggers>
        <Root level="debug">
            <AppenderRef ref="STDOUT" level="info" />
            <AppenderRef ref="Rolling" level="info" />
        </Root>
        <Logger name="pt.ua.dicoogle" additivity="false">
            <AppenderRef ref="STDOUT" level="info" />
            <AppenderRef ref="Rolling" level="debug" />
        </Logger>
        <Logger name="org.eclipse.jetty" additivity="false">
            <AppenderRef ref="STDOUT" level="warn" />
            <AppenderRef ref="Rolling" level="info" />
        </Logger>

        <!-- specific configuration for your plugin. Use the project's
          class hierarchy root. We put `additivity="false"` to prevent
          other loggers from repeating the same lines.
        -->
        <Logger name="pt.ua.dicoogle.my.plugin" additivity="false">
            <!-- print everything except TRACE to console output -->
            <AppenderRef ref="STDOUT" level="debug" />
            <!-- and print everything to .log files -->
            <AppenderRef ref="Rolling" level="trace" />
        </Logger>
    </Loggers>
</Configuration>
The JVM variable log4j.configurationFile should then be defined when running Dicoogle, as thus:
java -Dlog4j.configurationFile=log4j2.xml -jar "dicoogle.jar" -s
Running a debugger
When trying to fix bugs in the plugin, sometimes just adding more prints is not practical, nor very helpful. Using a debugger to step through the code can be more effective at understanding the current behaviour of the software, including what’s wrong with it. A small tutorial follows, we will show the necessary steps to debug Dicoogle plugins using Visual Studio Code or, alternatively, IntelliJ IDEA. Although IDEs are not the same, they will usually involve a very similar process to the shown below.
Fetching all source repositories
First, we need the source code for both Dicoogle and the plugins that we wish to debug. Using a command-line Git client, fetching the source code for Dicoogle is simple:
git clone https://github.com/bioinformatics-ua/dicoogle.git
In this situation, you may consider checking out a released version to ensure compatibility:
git checkout 3.0.2
The same source code can be downloaded from GitHub in the Releases page. For the plugins, we suppose that you already have their respective source code. Nevertheless, if you wish to debug one of the publicly available plugins, we provide the source code on demand via the Downloads page.
Visual Studio Code
Preparing the IDE
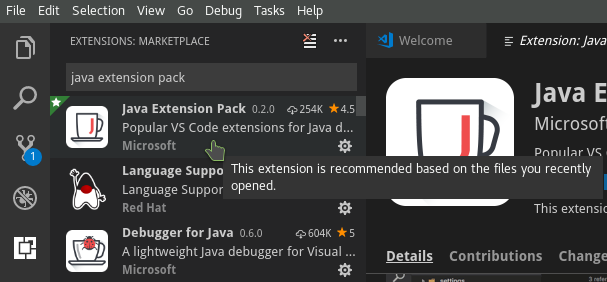
You can download Visual Studio Code for free from the official website. Please ensure that you have the latest stable version. In order to debug Java programs, we also need the “Java Extension Pack”, which can be installed directly from the IDE, in the Extensions Marketplace. Please install this extension pack and reload Visual Studio Code afterwards.
Preparing the workspace
Before we start using Visual Studio Code, let’s create a new folder similar to our “DicoogleDir” folder, with the following hierarchy:
 dicoogle-run-debug
 .
 ├── Plugins
 |   ├── ...
 |   ├── nifti-plugin.jar
 |   └── list-plugin.jar
 └── storage                (optional)
     ├── «my-dicom-data»
     └── ...
Basically, we are preparing a working directory for debugging purposes, containing only the necessary plugins (don’t forget the plugins!). If some data is needed, include it as well. We also do not need dicoogle.jar because we’ll be using the source code directly to build and run the respective class files.
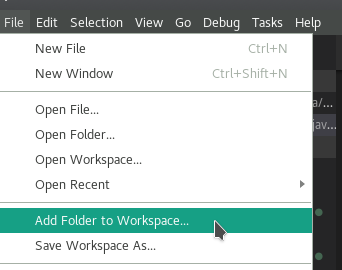
Open the source code’s root folder with Visual Studio Code. Then, include the root folders of each plugin by adding them to your workspace (see the screenshot below). In this example, we will load two plugins that extend Dicoogle with web services: dicoogle-nifti and dicoogle-list.
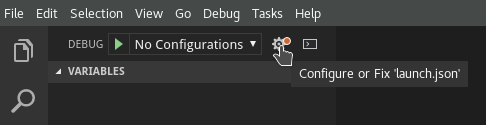
At this point we should have multiple folders in the Explorer tab (you can press Ctrl+Shift+E if it’s not visible). Consider saving the workspace file to our new “dicoogle-run-debug” folder. Next, open the Debug tab (Ctrl+Shift+D) and set up a new launch configuration for “dicoogle” (the core project):
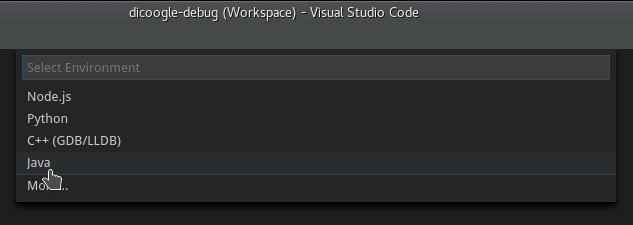
At the top, when requested to choose the type of program, choose Java:
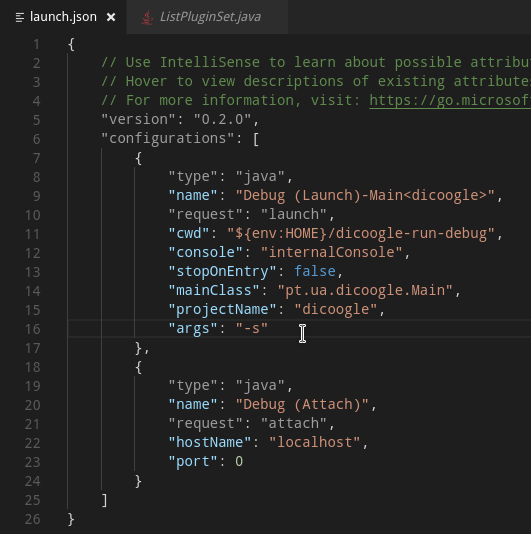
Visual Studio Code will automatically prepare us most of the configuration required. We still need to perform a few changes:
- Only the “Debug (Launch)-Main<dicoogle>” and “Debug (Attach)” configurations are required. Other stray configurations can be removed from the JSON object.
- We need to change the
cwdfield of the first configuration to the folder that we created. This is the working directory that the debugger will assume when running Dicoogle. Without it, the debugger will use the root source code folder, and the intended plugins will not be loaded. - We can also add the “-s” flag to the command line arguments to prevent Dicoogle from opening the browser.
    {
        "type": "java",
        "name": "Debug (Launch)-Main<dicoogle>",
        "request": "launch",
        "cwd": «PATH TO DICOOGLE DIR»,
        "console": "internalConsole",
        "stopOnEntry": false,
        "mainClass": "pt.ua.dicoogle.Main",
        "projectName": "dicoogle",
        "args": "-s"
    },
The launch.json file should be something similar to the following:
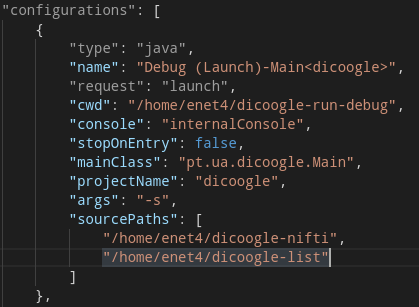
Note that The IDE should be able to know where to find the plugins’ source code, because they are living in our workspace. However, in some cases, it may also be required to specify the source paths of each plugin. This may also be required in other IDEs. See the screenshot below for an example.
Using the debugger
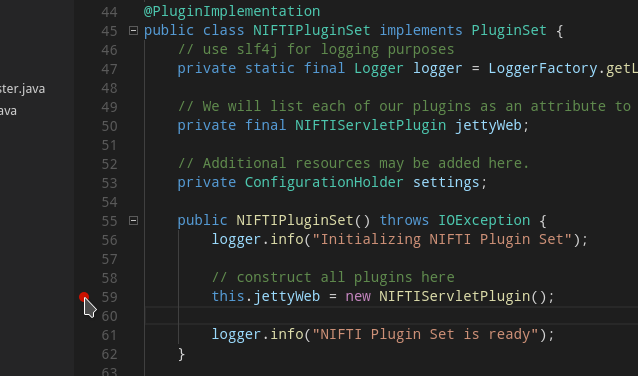
To make sure that everything is properly set up, let’s add a breakpoint or two in our code. In one the plugin set classes, add a breakpoint by clicking on the left side of a code line. A red dot should appear where you clicked.
We can now press the “Start Debugging” button on the Debug tab to run Dicoogle through the debugger. After a few moments, the program should stop at the given breakpoints.
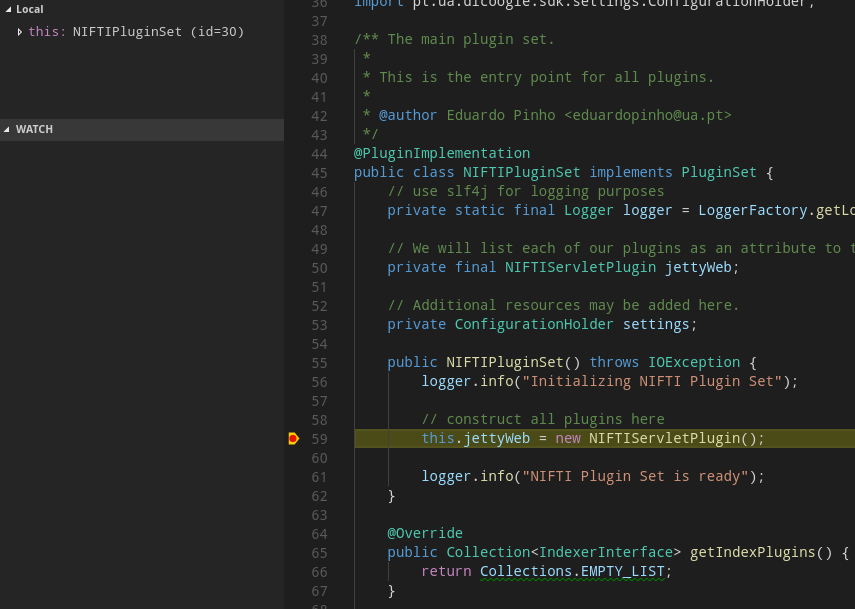
It is now possible to slowly step through the code and observe the state of your plugin. More information on debugging with Visual Studio Code is available at the official website here.
IntelliJ IDEA
Preparing the IDE
You can download IntelliJ IDEA Community version for free from the official website, compatible with Windows, macOS and Linux.
Preparing the workspace
Before we start using IntelliJ IDEA, let’s create a new folder similar to our “DicoogleDir” folder, with the following hierarchy:
 dicoogle-run-debug
 .
 ├── Plugins
 |   ├── ...
 |   ├── nifti-plugin.jar
 |   └── list-plugin.jar
 ├── storage                (optional)
 |   ├── «my-dicom-data»
 |   └── ...
 └── dicoogle.jar
Basically, we are preparing a working directory for debugging purposes, containing only the necessary plugins (don’t forget all the plugins!). If some data is needed, include it as well. Open the source code’s root folder with IntelliJ IDEA.
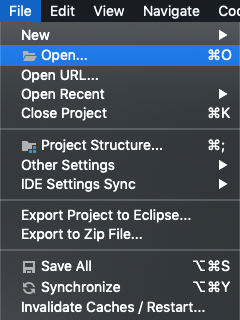
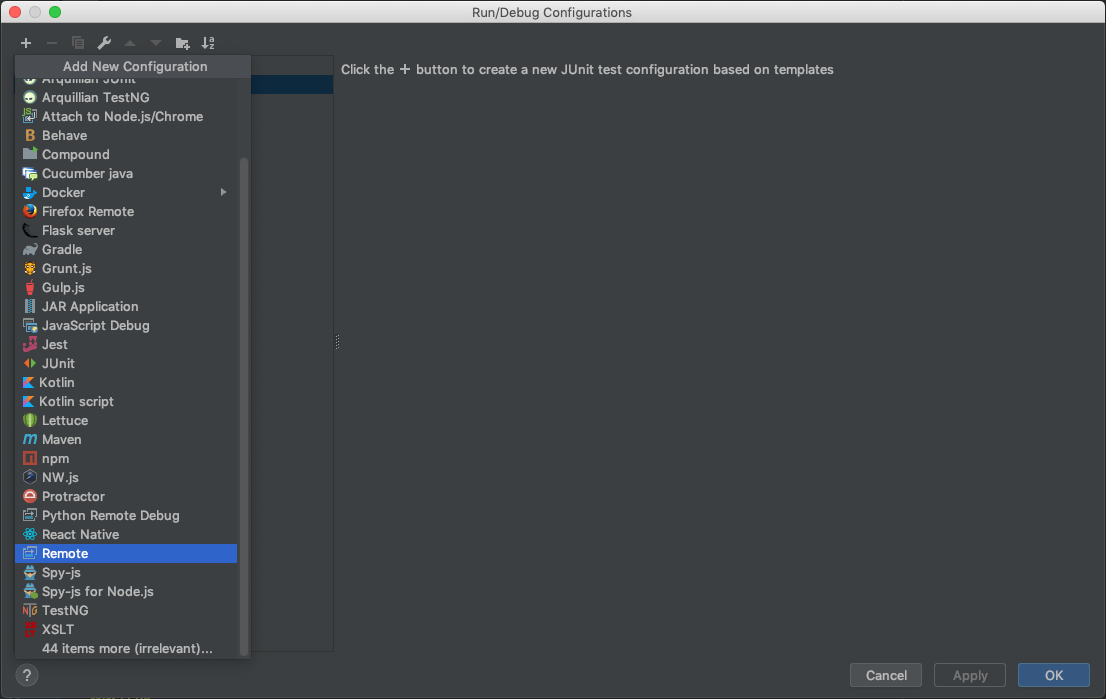
Next, we will configure the Remote Debug in IntelliJ. On the top right corner, open “Add Configuration”. From the “+” icon, choose “Remote”, as shown in the screenshot below. You can use the default settings from the IntelliJ IDEA Remote run/debug template.
Using the debugger
At this point, all the required settings are completed. To start debugging, start Dicoogle with the flag -agentlib:jdwp=transport=dt_socket,server=y,suspend=n,address=5005. Example:
java -agentlib:jdwp=transport=dt_socket,server=y,suspend=n,address=5005 -j dicoogle.jar -s
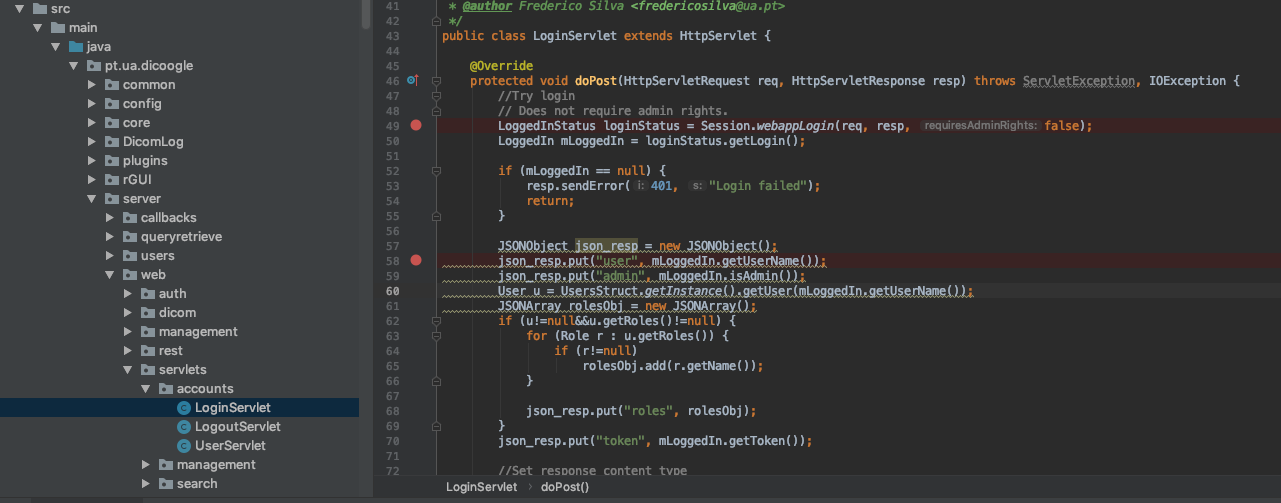
To make sure that everything is properly set up, let’s add a breakpoint or two in our code. In one the plugin set classes, add a breakpoint by clicking on the left side of a code line. A red dot should appear where you clicked.
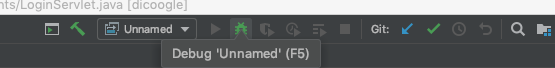
We can now press the Debug button on top right corner (or by clicking F5) to start debugging. After a few moments, the program should stop at the given breakpoints.
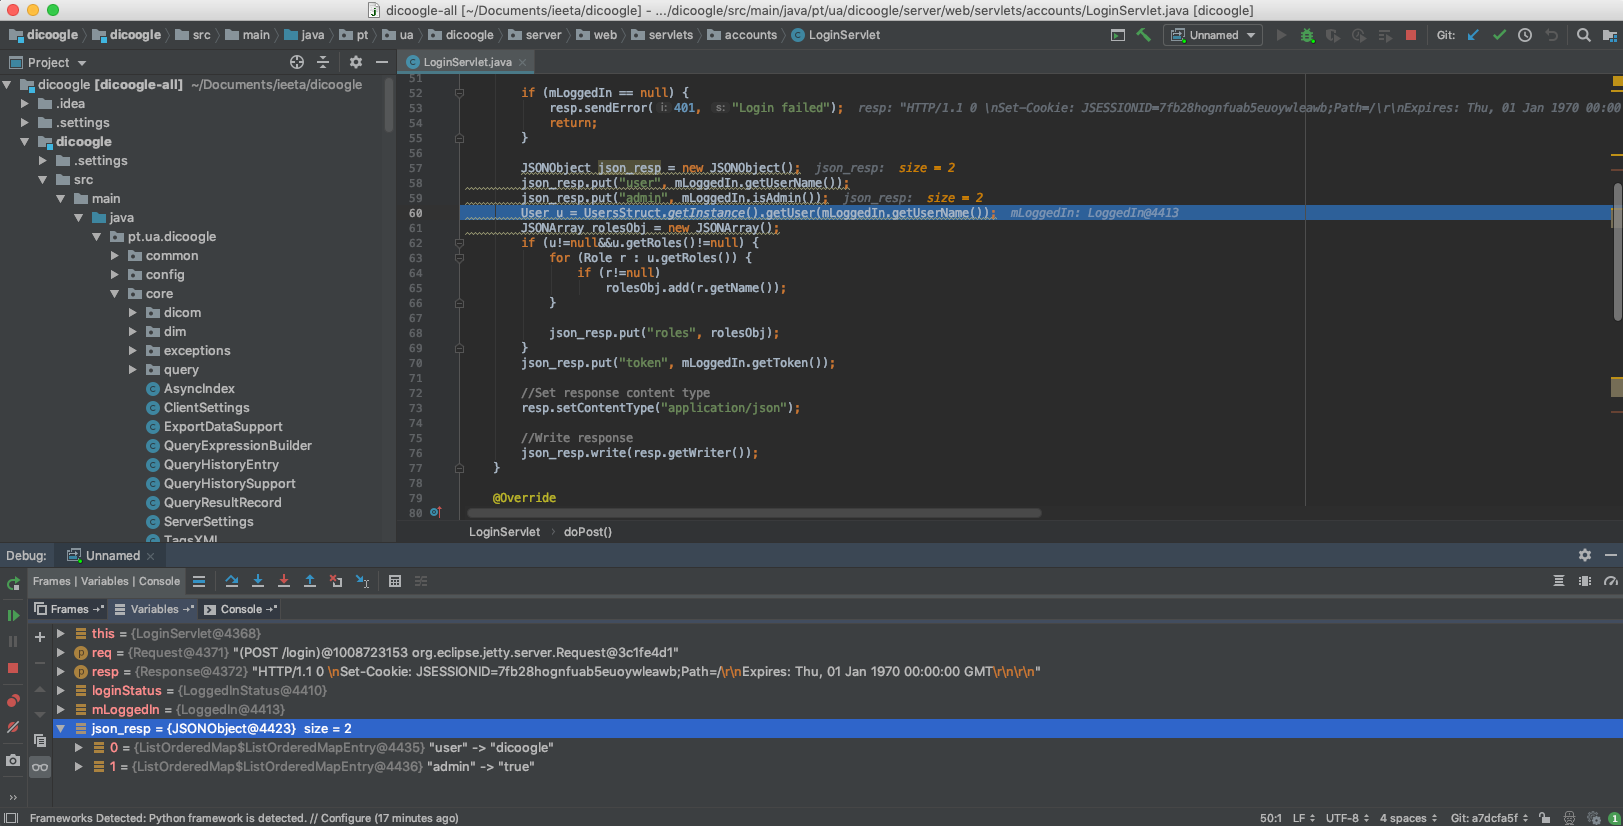
 In this example, we added some breakpoints in pt.ua.dicoogle.server.web.servlets.accounts.LoginServlet > doPost(), which means that the program should stop when you try to login in Dicoogle on the browser:
It is now possible to slowly step through the code and observe the state of your plugin.