Chapter 3 Software User Manual
This chapter presents the main interfaces of BIcenter, aiming to help users to navigate through the system.
3.1 Initial views
The login page presented in Figure 3.1 allows users to be authenticated using their credentials. This can be connected with the institution LDAP, which provides a central place to store usernames and passwords.

Figure 3.1: Login page.
After the authentication process, the user is redirected to the application’s home page represented in Figure 3.2. This page contains all the institutions that the user belongs to. In this case, this user has permission to create a new instance of an institution in the application using the modal illustrated in Figure 3.3.

Figure 3.2: Home page after login with all institutions assigned to the user.
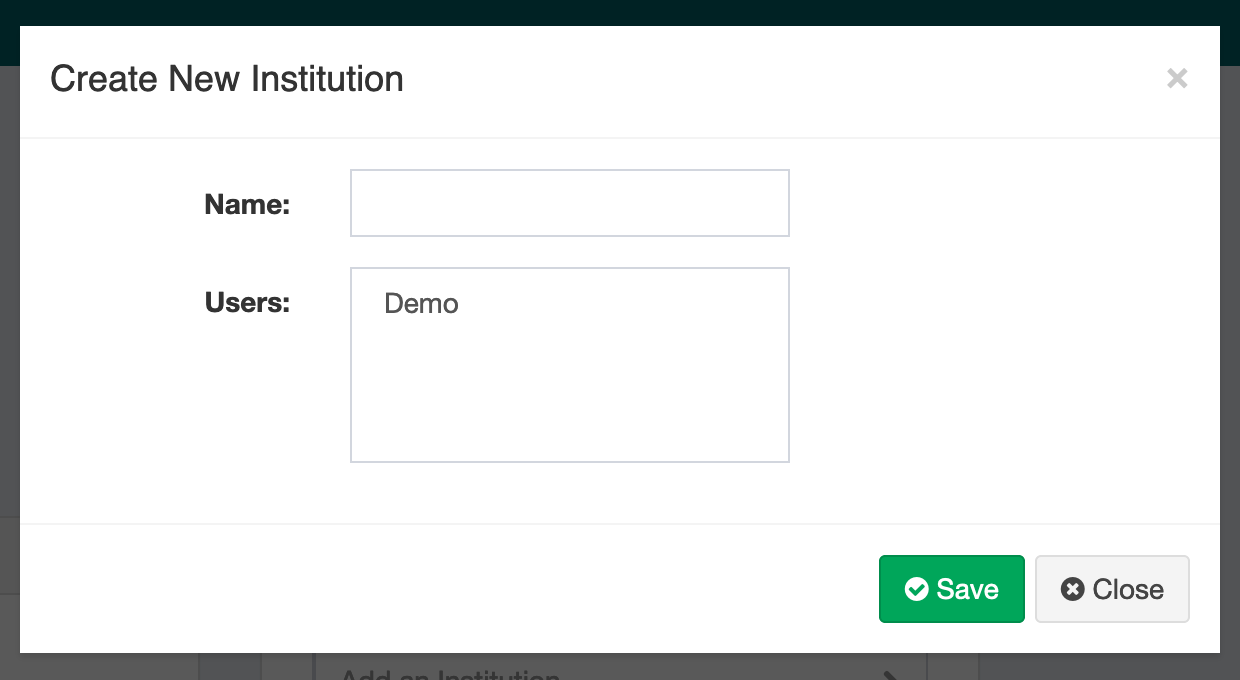
Figure 3.3: Modal to create new institution.
3.2 Institutional features
The configuration of a data source is illustrated in Figures 3.4 and 3.5. Firstly is created the data source instance in the institution, and then, the details of this connection are inserted in the modal represented in Figure 3.5.
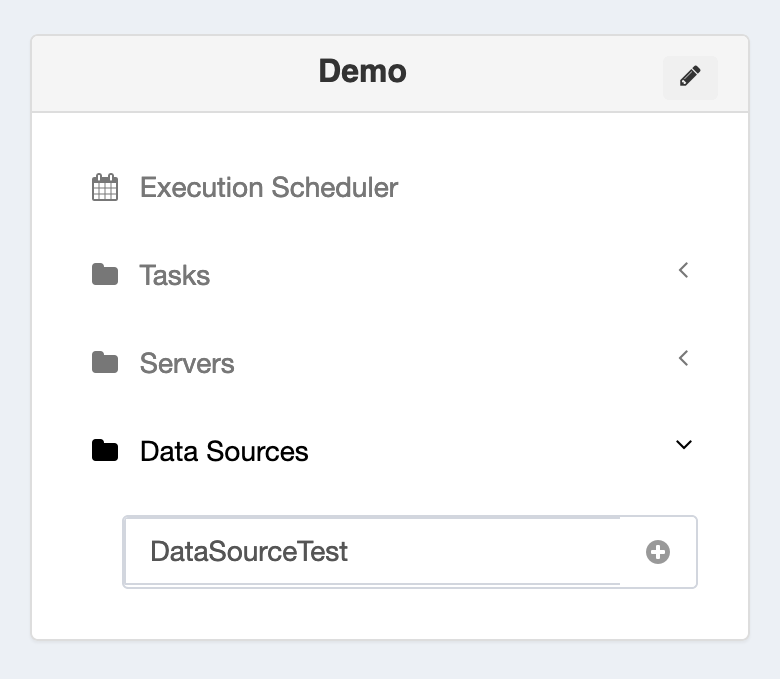
Figure 3.4: Creation of connection to a data source (first step).
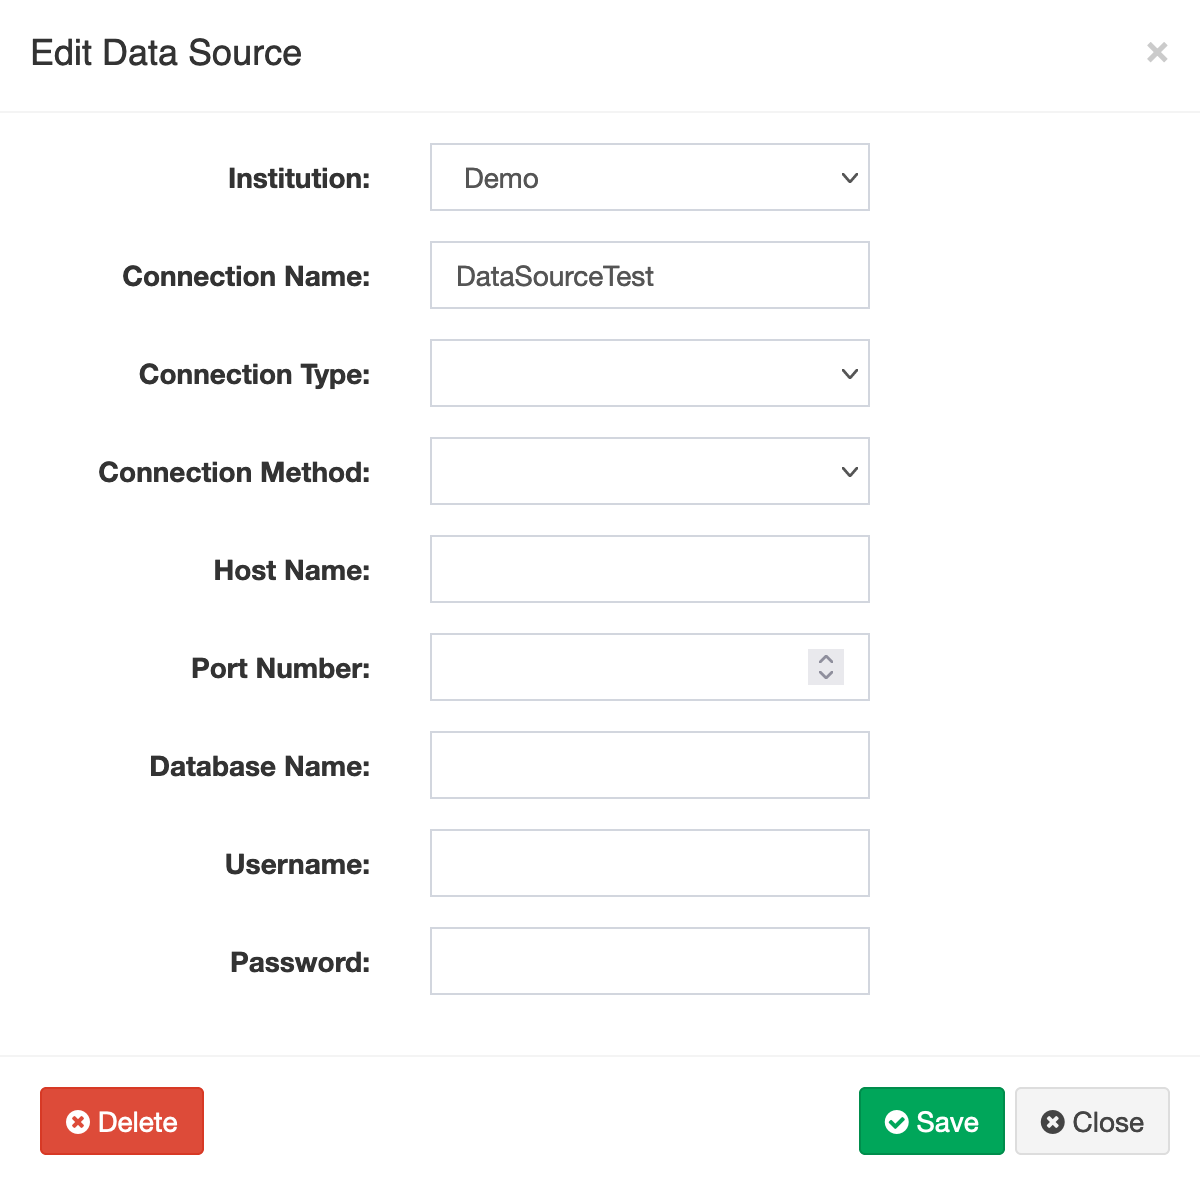
Figure 3.5: Modal to insert information regarding the new connection to a data source (second step).
The connection to the remote server follows a similar flow. This configuration is illustrated in Figures 3.6 and 3.7.
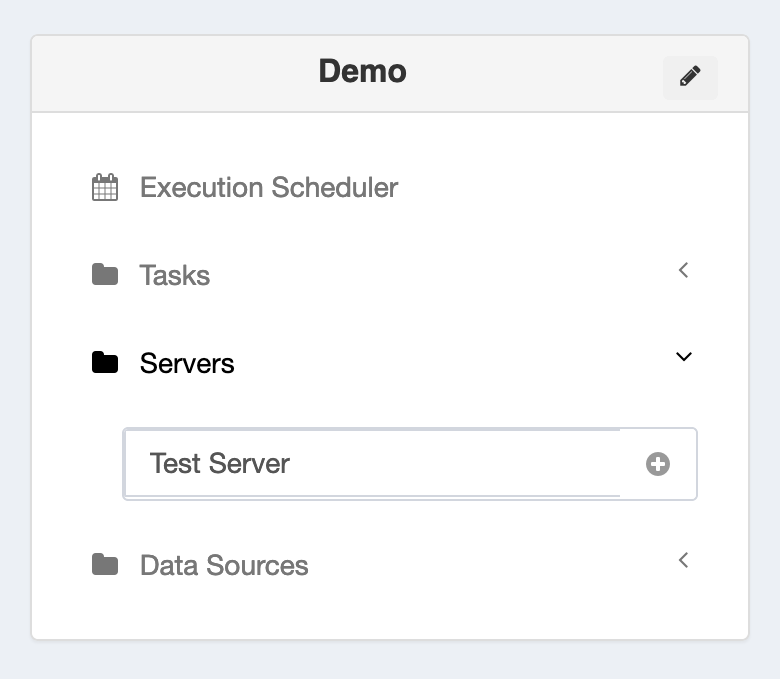
Figure 3.6: Creation of connection to a remote server (first step).
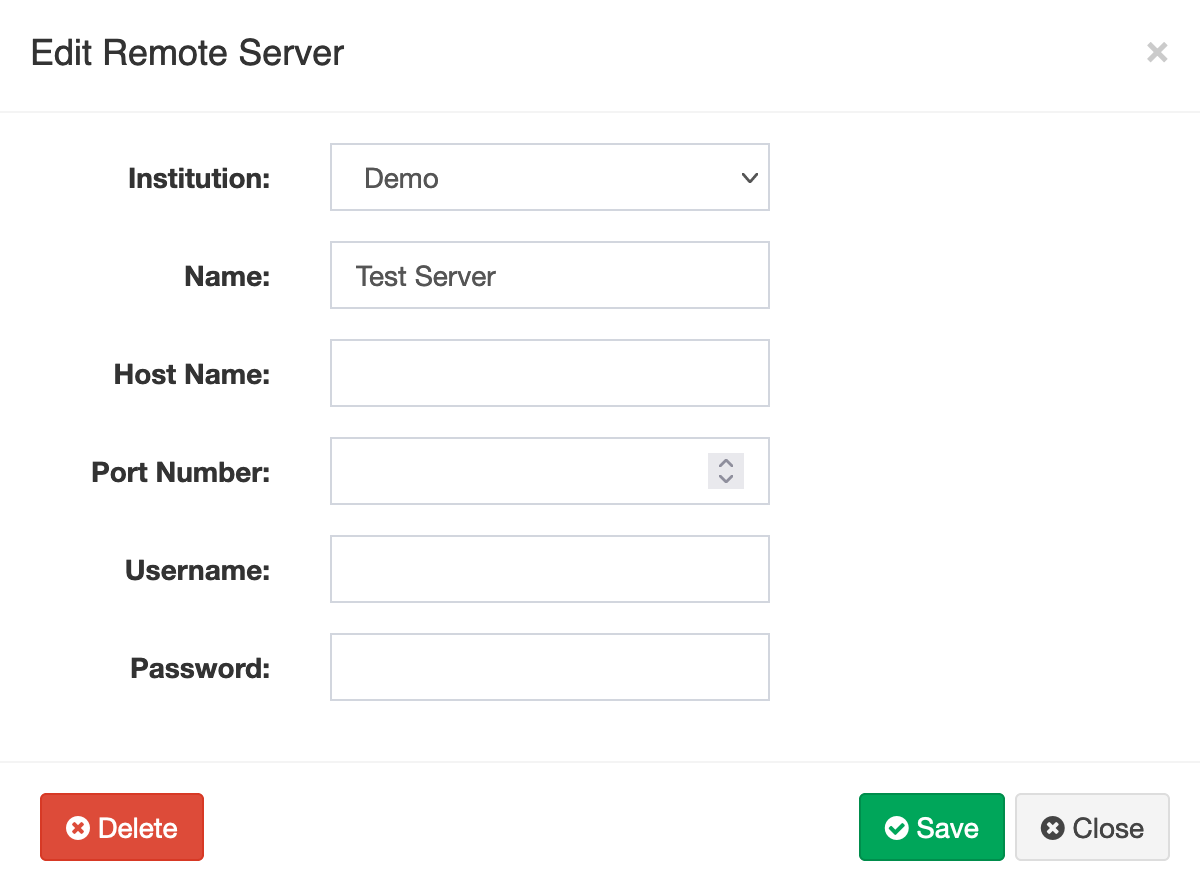
Figure 3.7: Modal to insert information regarding the new connection to a remote server (second step).
Finally, the ETL tasks are also created for the institutions. This feature redirects the users to the ETL Task Editor, in which they can design and implement an ETL pipeline using the web interface. The creation of a new task can be done by using the option represented in Figure 3.8.
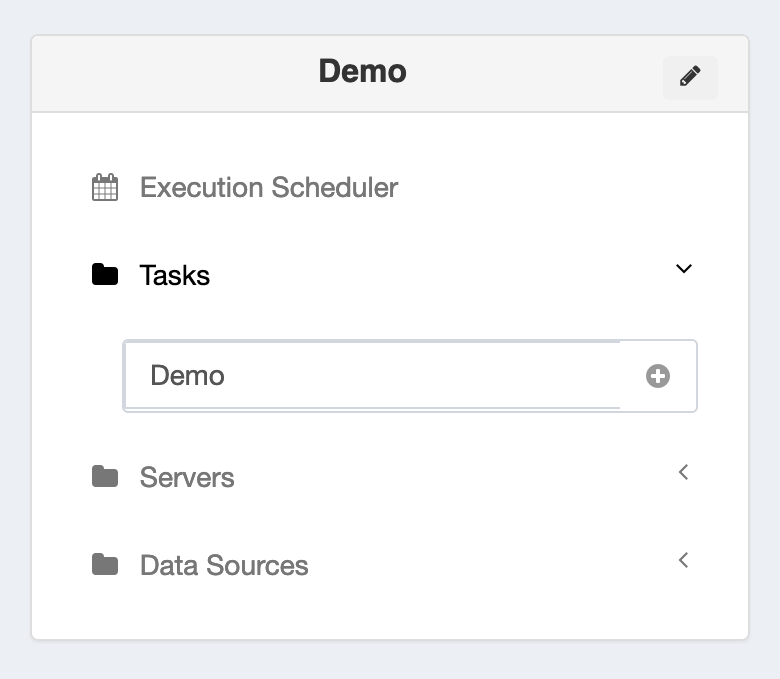
Figure 3.8: Creation of a new ETL task (first step).
3.3 ETL Task Editor
The ETL Task Editor allows users to create an ETL pipeline by dragging and dropping ETL components. Figure 3.9 shows an overview of this web editor.
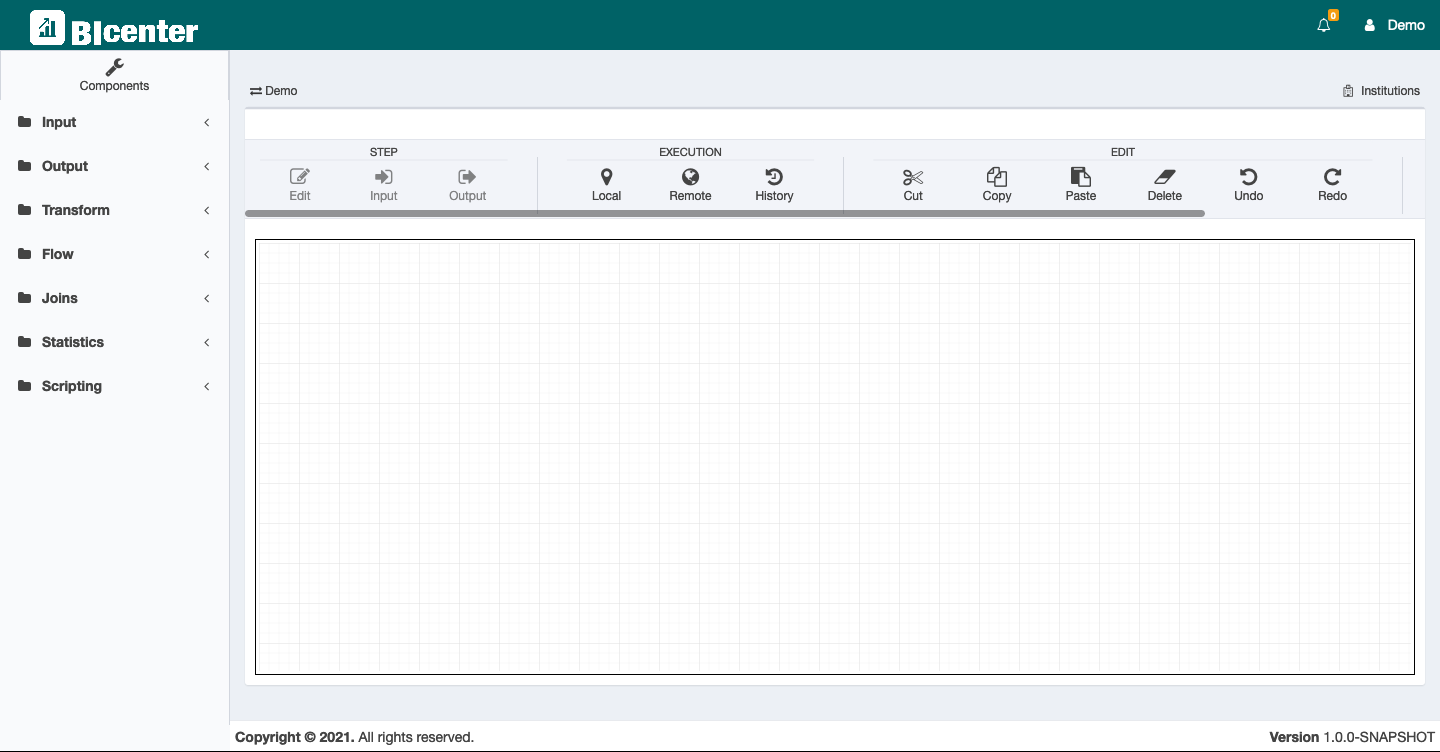
Figure 3.9: Overview of the ETL Task Editor.
Figure shows an example of an ETL pipeline implemented in the ETL Task Editor using the four most common ETL components.

Figure 3.10: Simple example of an ETL pipeline represented on this editor
The components available to implement these ETL pipelines are available on the left menu. Part of this menu is represented in Figure , which is expanded the components for input, output and transformations.
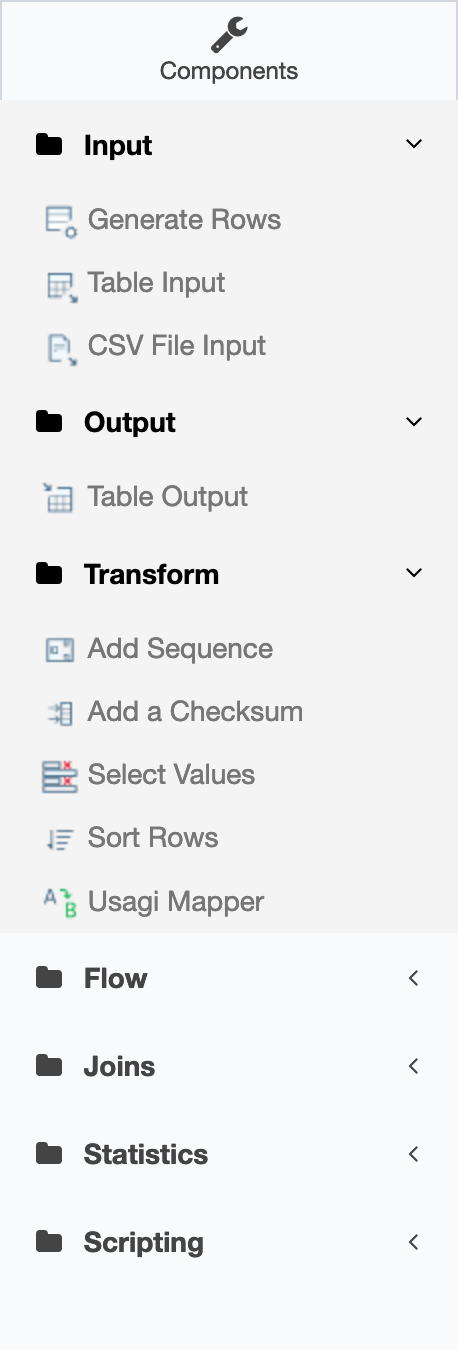
Figure 3.11: Overview of part of the ETL components currently deployed in the system.
The navigation bar illustrated in Figure allows the uses to operate over the ETL Task. This menu is divided into sub-menus: 1) step, which contains the features to configure each ETL component in the pipeline and analyse the input and output of each step; 2) execution, which defined if the ETL task will be executed locally or in a remote server; edit, contain the editing usual features, such as cut, copy, paste, delete, undo and redo; and 4) select, which is related with the drawing features.

Figure 3.12: Main features of the ETL Task Editor.